Getting Started with OpenRefine

This guide is a companion to the Data Preparation for Digital Humanities Research workshop. It is designed to help you begin using OpenRefine to:
- ☞ facet data
- ☞ filter data
- ☞ cluster data
- ☞ transform data
Create Project
Download data (authors-people.csv) This dataset was created by the British Library. We thank them for their love of comics. More details about the dataset will surface as you work through it with OpenRefine.
Choose file(s) for your project
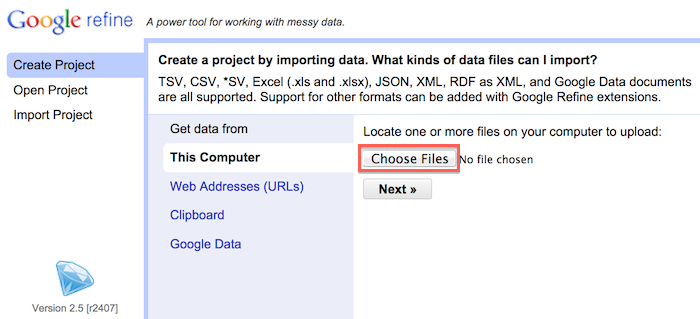
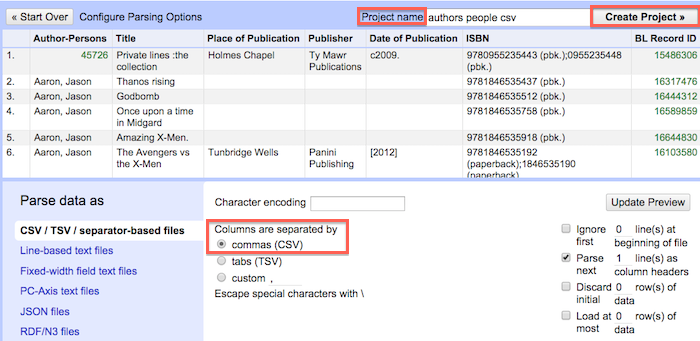
Parse data as CSV > Assign project name > Create project
Examine data
Take a minute to look around. Consider the structure of the data with principles of "tidy data" in mind. This will help guide what types of operations you perform on the data. Also take time to evaluate the type of information that is represented and what type of questions you might want to ask of it (e.g. Which publishers are most prominently represented in the collection?)
Facet data
Each column has a facet function that allows you to quicky identify inconsistencies in your data by counting the number of unique occurences for each piece of data in that column. Using this function we will analyze the distribution of comics in the dataset by publisher. The first step is to begin assessing the consistency of data in the Publisher column. Try the following sequence of steps:
1. Click the Publisher column > Select Facet > Select Text Facet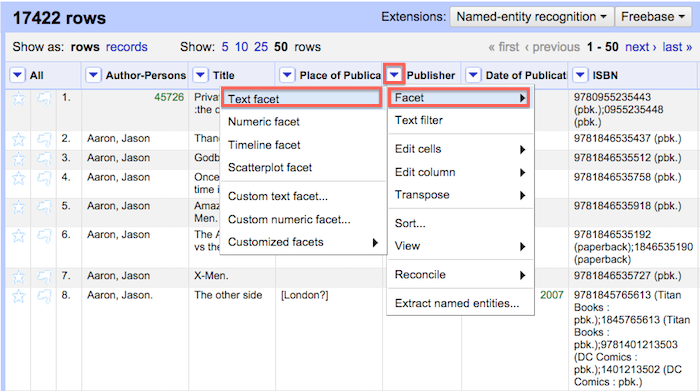
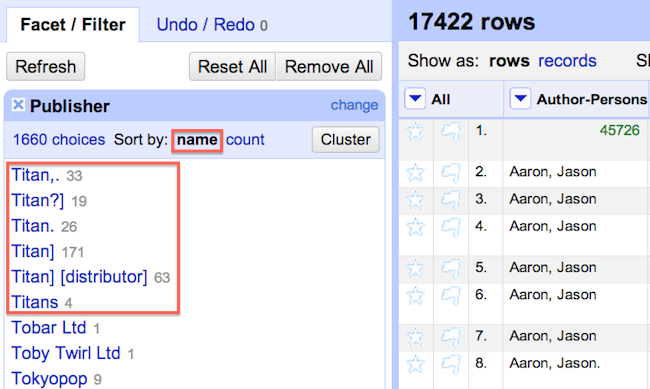
Note: In addition to the standard facet there a number of custom facets available that perform functions like detecting duplicates and text length. It is also possible to create and store facet functions for later use.
Filter data
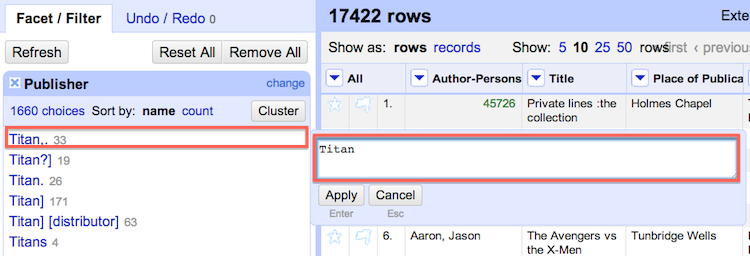
Each column contains a 'text filter' function. The text filter is useful for identifying pieces of data that may have many variants. Based on the previous section we know that the Publisher Titan may be represented in a variety of ways. In order to explore this further we use the text filter to filter for all occurences of Titan.
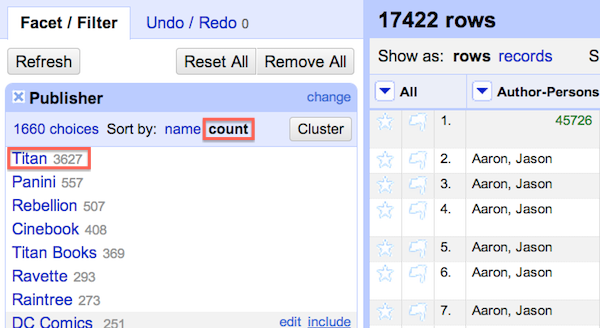
A couple of interesting things result. We see at the top that 4684 rows match Titan. If we were going on the result from step 3 in the prior section we could have assumed that 'Titan' had only 3627 comics in the collection. Closer examination using the text filter function shows us how many records we might have missed as a result of typos and variant spelling.
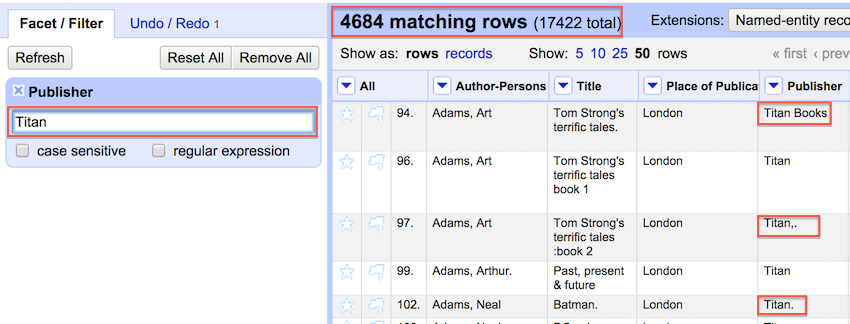
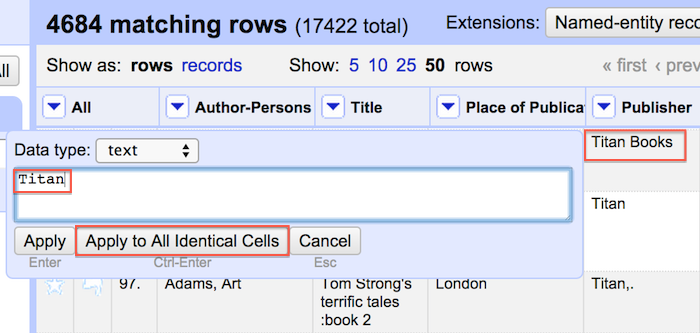
At this point it is possible to remove some of the observed inconsistency by clicking the edit option within individual variant cells and applying that change to all identical cells.
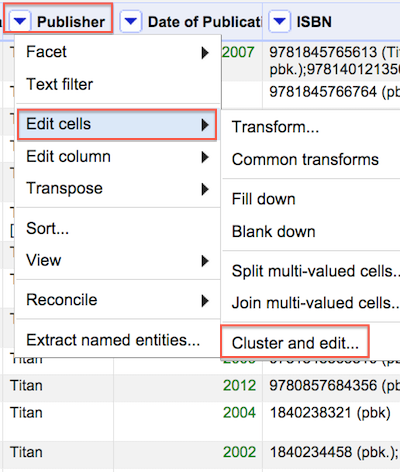
Cluster data
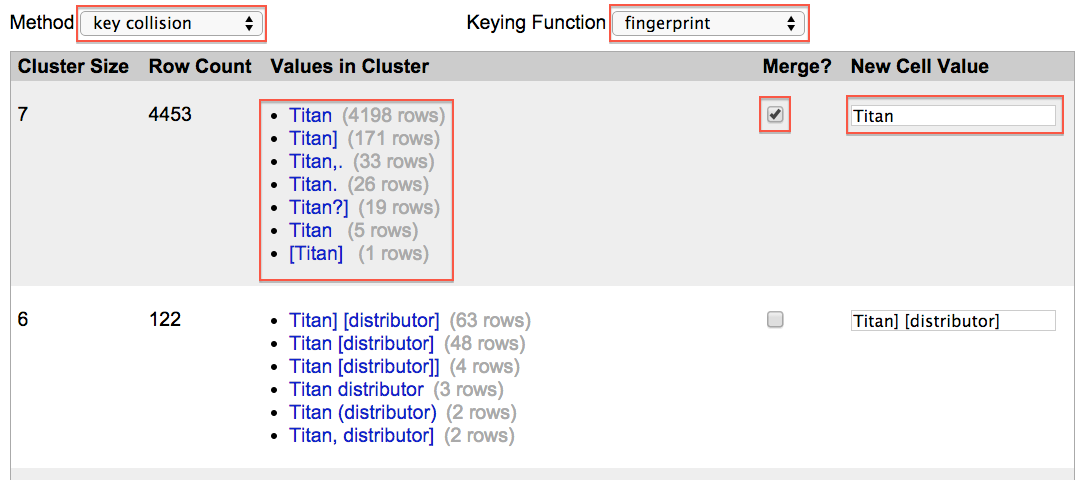
In addition to faceting and filtering it is also possible to cluster and normalize variation across the dataset. Clustering will look for patterns of variation without the need for you to (1) sleuth your way through the dataset looking for small variations (2) using facets or filters to eliminate them one at a time. Begin with the default method of 'key collision' using the 'fingerprint' function. For more information on all of the available clustering methods and functions consult OpenRefine documentation on Github.
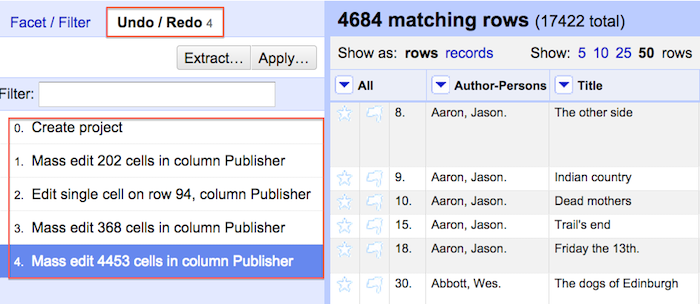
Clustering reveals patterns of irregularity throughout the selected column of data. It is then possible to review clustering results and merge the data into the desired form. In the below example merging variant data from the first section to the 'Titan' form will alter 4453 records.
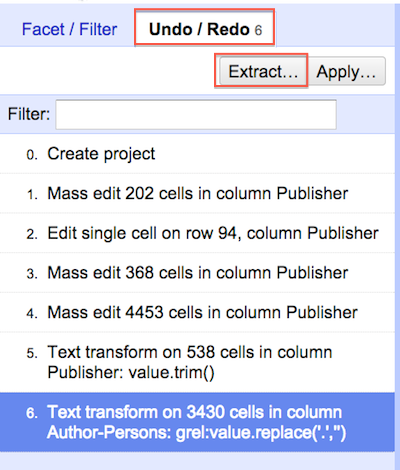
If making this many changes at once makes you nervous, no need to worry. One of the great features of OpenRefine is that it stores your data edit history and allows reversion of data to previous states at any stage.
Transform data
There are two different ways to transform data using OpenRefine. The first method allows you to utilize preset transformations that perform functions like trimming leading and trailing whitespace (an extra space at the beginning or end of an entry). This might seem like a trivial sort of data formatting issue but without this transformation each piece of data with an extra space at beginning or end would be intepreted as different from an otherwise identifical piece of information (e.g. " Titan" and "Titan")
The other method of transformation allows you to utilize the OpenRefine Expression Language (GREL) to normalize data. In the following example we use a simple regular expression to replace all instances of a period in the Author-Persons column. This action modifies 3430 author names. If we did not use GREL it would take us quite a long time to work through every location of a period associated with each author in the dataset.
![]()
![]()
![]()
Export
Once you get to a stage where you think your data is ready, you'll have no shortage of options for getting it out of OpenRefine and into the world.
Data export in multiple formats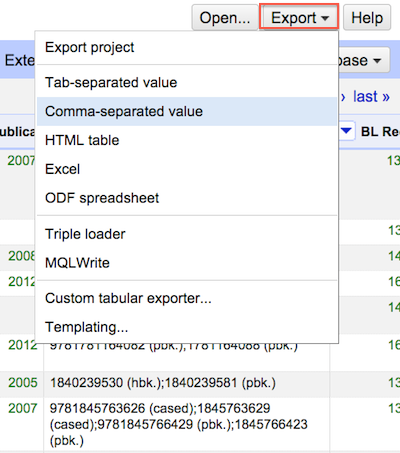
Advanced
If you are interested in pushing OpenRefine further consider (1) OpenRefine Recipes, (2) delving into Open Refine Expression Language (GREL), and (3) consulting the Resource section below.
Resources
Owen Stephens, Working with Data Using OpenRefine Seth Van Hooland, Ruben Verborgh, Max De Wilde."Cleaning Data with OpenRefine". Programming Historian. Shawn Graham, hist3907b-winter2015/module3-wranglingdata/openrefine Free Your Metadata